

#82: What's the secret to finding hidden insights from your data?🗝️

Hello,
This newsletter will take you about 4 minutes to read.
I. Spotlight: What's the secret to finding hidden insights from your data?🗝️
“Can you find unusual insights from this data?” asked the technology head of a global pharma company. It was a hot summer day, and this was our first meeting. We sat in his office looking at a spreadsheet on his laptop.
This executive’s team managed the performance of strategic software vendors for the pharma company. Each of these vendors had contracts worth millions of dollars. The team ran internal surveys to get business’ feedback for all vendors.
This was the survey data the executive was showing us. At a few hundred rows, it was a fraction of the massive data warehouse his team routinely used.
The team had been creating descriptive summaries of the survey feedback for their quarterly vendor reviews. However, the dashboards weren’t very actionable. With the next review coming up in 2 weeks, the executive wanted to try something different.
Pointing to the spreadsheet, he said, “If you could do some magic with this data and discover unusual, actionable nuggets, we’ll work with your company.”
Those were the early days of Gramener. Data storytelling and analytics weren’t as popular as they are today. Traditional BI tools from larger companies such as IBM were good at providing access to data, not to insights.
In a bid to win the client, we took up this challenge.

To find unusual answers, you must ask unusual questions
You can’t unearth hidden stuff if you look in the same places as everyone else. You must come up with probing and unusual business questions. The answers will then reveal vital clues to help your users meet their objectives.
Here are the questions we asked:
What are the key attributes that matter most to your business users - ex. ‘value for money’, ‘responsiveness’? Which survey questions map to these attributes?
What’s the unusual rise/drop in ratings for these attributes? In such exceptions, what do the users’ textual comments call out?
What’s the relative ranking of a vendor on these attributes? Is it consistent over time?
While pivot-table summaries can paint the big picture, you need sharp questions to find what lies beneath the surface. However, not everything you discover will be an insight. Many will be mere facts.
How do you differentiate insights from facts? Here’s a litmus ‘BUS’ test you can use:
Is it Big: Is the insight numerically significant? Will it substantially move users towards their outcomes?
Is it Useful: Does the finding just inform the audience, or will it make them act?
Is it Surprising: Is it non-obvious? Even if it validates a gut feel, does it provide new proof?
We use this in our projects to pressure-test the insights by throwing them under the BUS! It works like a charm.
We went back to the pharma executive with the insights in 10 days. Soon he was firmly on board. These findings were the anchor point for their quarterly strategic review.
Sure, the insights caught the vendor teams by surprise. But, they led to productive discussions and healthy competition among vendors.
For Gramener, this project led to a strategic partnership with the pharma company.
Whether your data is big or small, it is always possible to find something unusual. Frame questions that are anything but ordinary, and your insights will be extraordinary.
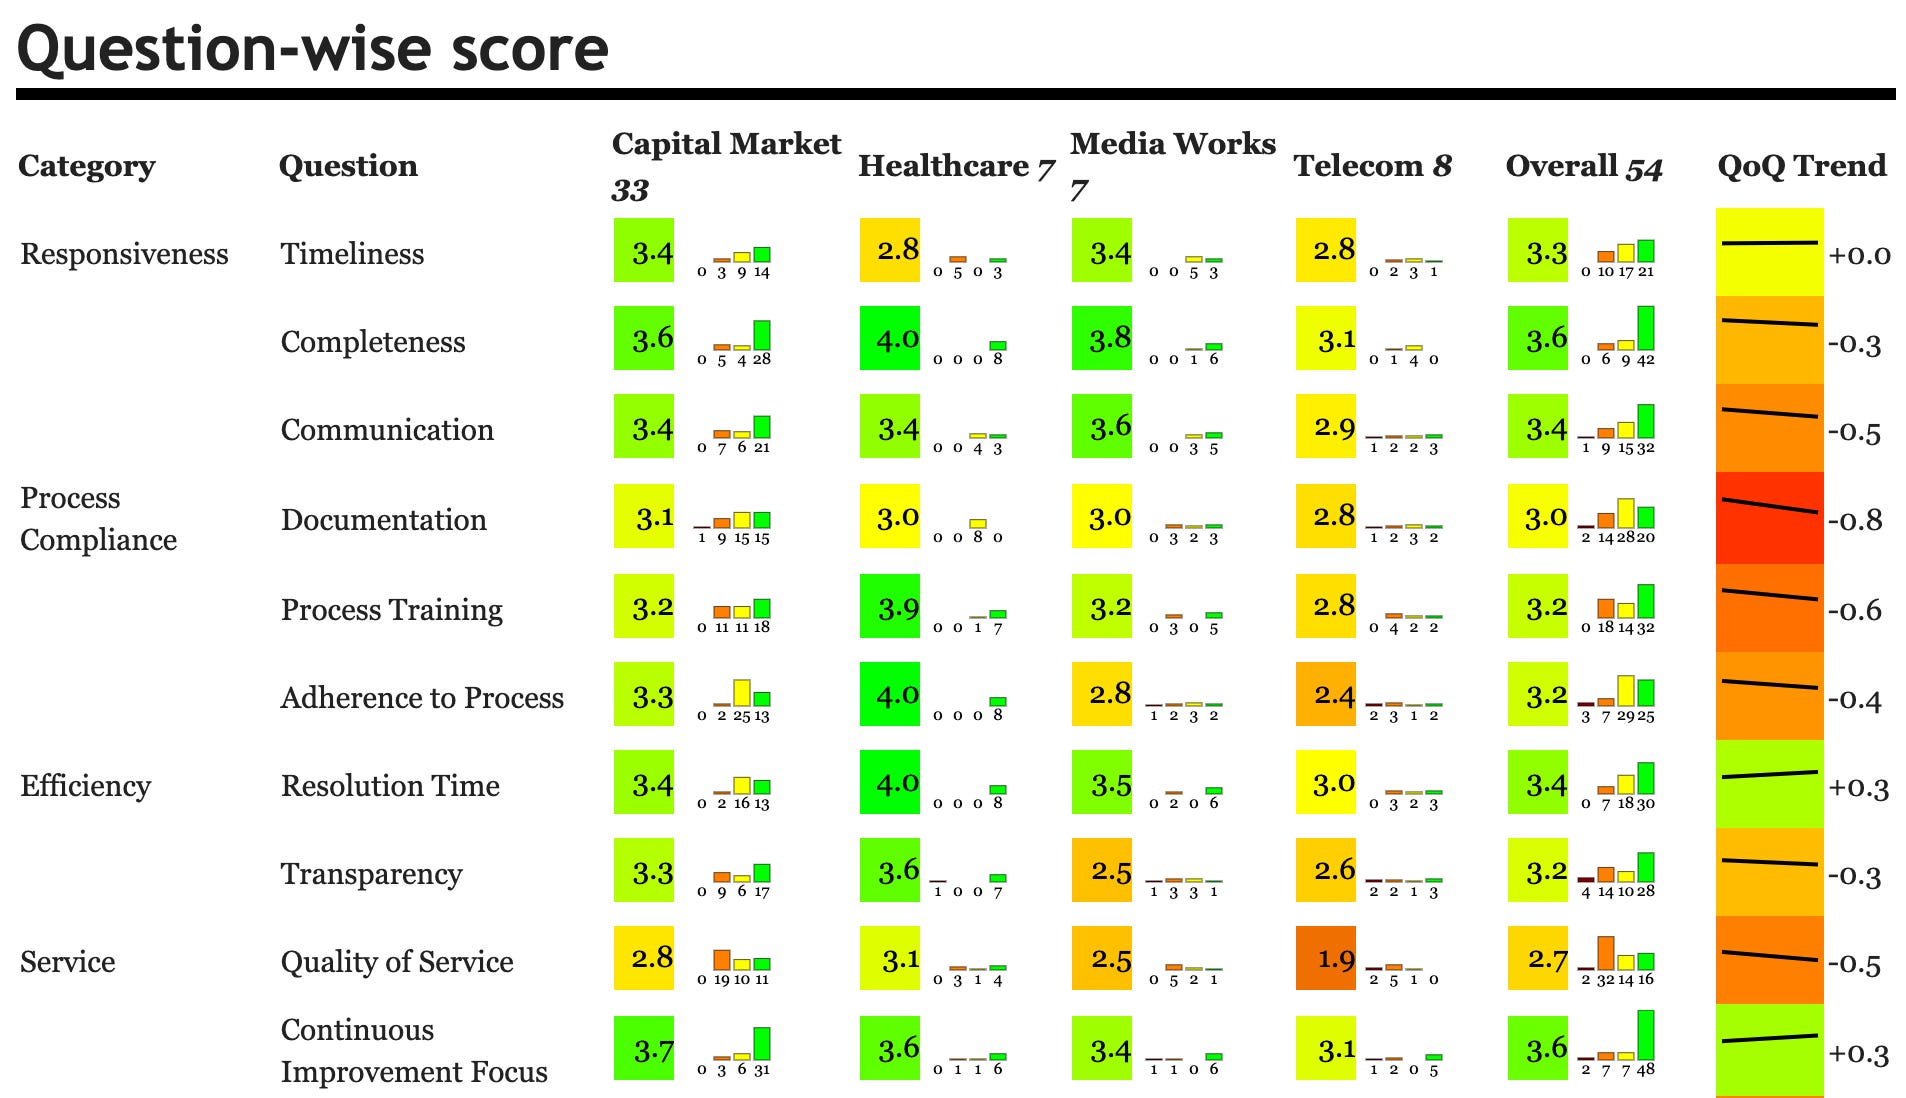
(Photo: Sample survey insights - Check the full report here)
II. Industry Roundup:

1. Article: The human side of generative AI: Creating a path to productivity
18 minutes | McKinsey | Aaron De Smet, Sandra Durth, Bryan Hancock, Et al.
Generative AI (Gen AI) is reshaping talent strategy, emphasizing higher cognitive and social-emotional skills over technical skills for both technical and non-technical roles. A McKinsey survey reveals that workplace flexibility and relational factors are increasingly valued over compensation, highlighting the need for human-centric job design in the AI era.
2. Book: Data Juice: 101 Stories of How Organizations Are Squeezing Value from Available Data Assets
370 pages | Amazon | Douglas B. Laney (Author)
Are you looking to unlock the true potential of your data? Data Juice by Douglas B. Laney is your go-to guide, offering over 100 real-world examples of how organizations transform data into powerful assets. This book is packed with actionable insights and expert commentaries, making it an essential read for data, business, and IT leaders. Whether you’re seeking inspiration or practical strategies, Data Juice will fuel your journey toward data-driven success in the Digital Age. Don’t miss out!
III. From my Desk:

1. Article: When Waste Management Companies Pick Up AI Tools
07 min | MIT Sloan Management Review
How is AI transforming the waste management industry? Garbage trucks quietly handle our waste week after week, but the industry faces safety, routing, and maintenance challenges. Discover how AI is revolutionizing waste collection. Explore bone-chilling narratives and real-world case studies in the piece.
Thank you for subscribing and reading the newsletter. I appreciate your attention,
Ganes.
PS: Did someone forward this to you? You can subscribe here.
My Website | LinkedIn | Twitter | YouTube
I’m Ganes Kesari. I publish ‘Data-Driven Future’ to help understand how data shapes our world, explore key trends, and explain what they mean for you today. I speak and write to demystify data science for decision-makers and organizations.
Recent Issues: